
 "Dead cat bounce for the rupee, but long term weakness still exists")
As the Indian rupee plumbs new depths against the US dollar one wonders how low the Indian rupee will go. After briefly going below 65 to the US dollar, the rupee closed at 63.36 on Friday.
That is a sharp technical bounce, indicating that a retracement to the long term bearish trend is possible. The problem with technical analysis is that once an asset class reaches new highs as the US dollar against the Indian Rupee there are no resistance levels in price identify targets. One has to use derivative tools like Fibonacci analysis or other technical indicators to get a sense to where the rupee can turn. Since we prefer price to give us a sense of future trend, we decided to look at two other related asset classes–the dollar index exchange traded fund (ETF) and INR-USD ETF.
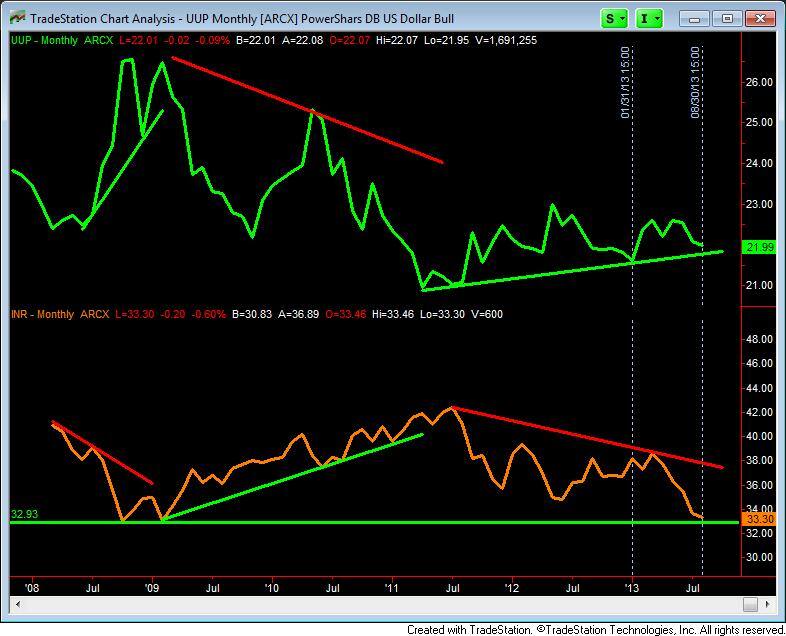
The dollar index measures the greenback against a basket of six major currencies. The ETF that follows the dollar index is UUP. So to track the dollar index we will look at UUP. The INR-USD exchange traded fund (symbol: INR) tracks the Indian currency against the US dollar. We will look at both these asset classes. UUP will tell us the strength of the dollar against global majors and INR will show us the inverse relationship between the Greenback and Indian currency among other things.
In several articles in the past we have spoken about the fiscal and monetary mess India is in. This has led to the sustained decline of the rupee. In this article we will focus on the charts to capture the potential trend of the Rupee. (click here to look at the combined chart of the UUP and INR)
[caption id=“attachment_1058057” align=“alignleft” width=“380”] 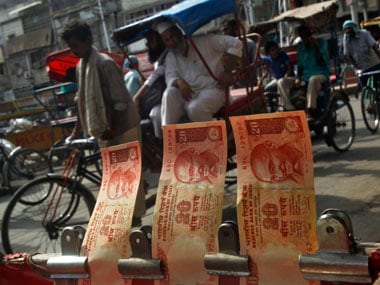 After briefly going below 65 to the US dollar, the rupee closed at 63.36 on Friday. Reuters[/caption]
The chart on the top is that of the UUP and the one below is that of the INR. First look at the green horizontal line in the INR chart at 32.93 . This could be support from where the currency can bounce. We don’t trust that support line as it is for the ETF on the stock market and not the actual INR-USD trades in the currency market. We think there could be bounce as the INR has fallen too fast too soon and then saw a sharp reversal on Thursday and Friday. The prices of ETFs based on future contracts suffer from contango and backwardation that affect prices and consequently support and resistance levels.
Impact Shorts
More ShortsFrom a long term perspective the rupee continues to show relative weakness against the dollar. If you look at the chart you will see green uptrend lines and red downtrend lines. Notice that whenever the dollar is in a uptrend, the rupee is in a downtrend. This is to be expected.
The important thing is that when the dollar is in a strong downtrend the rupee is either flat of has a weak uptrend. We say this because even when the dollar does not make a new high the rupee makes a new low. Look at the vertical lines on the chart that mark the turning points in UUP and INR. This shows that the rupee is relatively more weaker than the US dollar.
The chart you are looking at is a long term monthly chart showing data since 2008. The downtrend in the rupee and the uptrend in the dollar is clearly evident. Even though the INR is in a secular downtrend prices don’t fall in a straight line. Hence we expect some bounce in the Rupee over the next few weeks. Unless there is some positive news for the INR on the fiscal and monetary front, we expect this to be a dead cat bounce.
Also notice that the dollar is close to its long term uptrend line and is expected to bounce on touching line in the near future. That should be negative for the long term trend of the rupee.

 "Russian drones over Poland: Trump’s tepid reaction a wake-up call for Nato?")
 "As Russia pushes east, Ukraine faces mounting pressure to defend its heartland")
 "Why Mossad was not on board with Israel’s strike on Hamas in Qatar")
 "Turkey: Erdogan's police arrest opposition mayor Hasan Mutlu, dozens officials in corruption probe")


](https://images.firstpost.com/wp-content/uploads/2013/08/RupeeIndia_Clipped_Reuters.jpg)